Research & Data
Impaired Driving
Impaired Driving involves the use of alcohol, drugs (legal or illegal) or a combination of alcohol and drugs. This behavior puts people at risk and is a violation of the New York State Vehicle and Traffic Law (VTL 1192). ITSMR has completed a variety of studies on impaired driving issues including ADWI, Drugs and Driving and Leandra’s Law.

Research Notes & Reports
Impaired Driving Arrests
 The past decade has brought about a number of changes across the nation that by nature are likely to have an effect on the issue of impaired driving, from tougher laws and penalties for violations of impaired driving laws to the legalization of both medicinal and recreational marijuana use. Although New York has not yet legalized the recreational use of marijuana, New York has enacted tougher laws and stiffer penalties. Such laws have focused on drivers with a BAC at or above the 0.18 level and the expanded use of ignition interlocks.
Since many factors, from enforcement to education to treatment, have an impact on a person’s decision to drive while impaired it is a challenge to attribute changes in impaired driving behavior to any single factor. However, it can be informative to examine any one of the factors over time to identify any changes that may have occurred.
Key Findings 2009 vs. 2018
- The total number of drivers arrested for impaired driving (alcohol or drugs or both) under the TSLED system dropped 29%; drivers arrested for alcohol-impaired driving dropped by 32% while drivers arrested for drug-impaired driving increased by 27%.
- Drug-impaired driving arrests were much more likely to occur during the day than alcohol-impaired arrests.
- IMPAIRED DRIVING ARRESTS: A DECADE OF CHANGE
(Published September 2019) - Download Full Report
Aggravated DWI (ADWI)
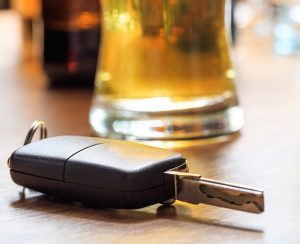 New York State has historically taken an aggressive approach to the problem of impaired driving. Approaches include legislation, enhanced and innovative enforcement efforts and increased public information and education initiatives. Success is evidenced by the reduction in the number of alcohol-related fatalities over the past three decades. In 2006, New York State implemented its Aggravated DWI Law (ADWI), providing stiffer fines and penalties for drivers with a BAC at or above the 0.18 level. This study examined how well the law is functioning today and provides information to the state’s Advisory Council on Impaired Driving to support its efforts to reduce impaired driving.
Key Findings
- 19%-20% of drivers arrested under TSLED each year, 2014-2018, had a BAC > 0.18.
- 93%-94% of the drivers with a BAC > 0.18 were charged with ADWI.
- 29%-32% of the approximately 6,000 drivers charged with ADWI each year, 2014-2018, were convicted of ADWI.
- NEW YORK STATE’S AGGRAVATED DWI (ADWI) LAW
(Published August 2019) - Download Full Report
BAC Reporting & BAC Levels
 ITSMR has completed a study on the issue of BAC testing rates and BAC levels, focusing on two distinct groups of drivers: 1) drivers ticketed for alcohol-impaired driving and 2) drinking drivers involved in fatal crashes. The study examined the BAC testing rates and levels of the drivers in each of these two groups and provides information by geographic location, driver gender and driver age.
Key Findings
- Approximately three-quarters of the drivers in each of these two groups had their BAC level tested.
- Of the drinking drivers in fatal crashes who were tested, drivers ages 50-59 had the highest average BAC (0.19%), whereas of the drivers ticketed and tested for alcohol-impaired driving, drivers ages 30 and above had the highest BAC (0.15%).
- BAC TESTING RATES & BAC LEVELS OF ALCOHOL-IMPAIRED DRIVERS ON NY ROADWAYS
(Published November 2018) - Download Full Report
Impaired Crashes
 In January 2018, the National Highway Traffic Safety Administration (NHTSA) reported that of the more than 37,000 people killed in motor vehicle crashes in 2016, 28% were killed in alcohol-impaired driving crashes. NHTSA further estimated that 22% of weekend/nighttime drivers tested positive for drugs. Because of the concerns raised by these findings, ITSMR has conducted a study on the involvement of alcohol and/or drugs in fatal and personal injury crashes on New York roadways, focusing on the five-year period 2015-2019. The study involve the examination of trends over time with regard to impaired driving crashes, including the characteristics of the crash event and the demographic characteristics of the drivers involved.
Key Findings
- 409 persons died in impaired crashes in 2019, representing 44% of the state’s traffic fatalities.
- 30% of the impaired drivers in 2019 were in the 21-29 year age group; 27% were ages 30-39.
- IMPAIRED CRASHES ON NEW YORK ROADWAYS: 2015-2019
(Published January 2021) - Download Full Report
Cannabis & Driving
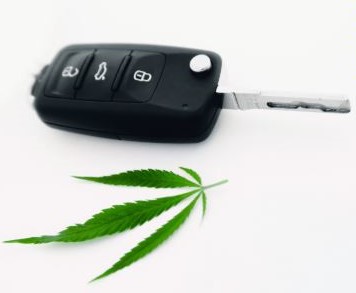 According to the National Survey on Drug Use and Health (NSDUH) 2018-2019, approximately 600,000 New York residents each year self-reported driving under the influence of cannabis (DUIC) in the past year. This figure is approaching the number of New Yorkers who self-reported driving under the influence of alcohol.
Effective March 31, 2021, New York State enacted legislation legalizing adult-use recreational cannabis. To gain insights into cannabis and driving before and after the legislation, ITSMR conducted a comprehensive study examining pre-law and post-law data on drivers who were evaluated by Drug Recognition Experts (DREs) for impaired driving and tested positive for drugs in their blood. Focusing on the period of 2018-2022, the study presents the following information on cannabis use and driving on New York’s roadways before the legalization and during its early phase: overview, drivers evaluated and tested, drugs found, characteristics of cannabis-positive drivers, and characteristics of cannabis-positive driving events.
Key Findings
- Delta-9-THC consistently emerged as the most frequently detected drug before and after legalization.
- Compared to drug-positive drivers before legalization, the prevalence of cannabis remained unchanged post-legalization, while narcotic analgesics and CNS stimulants showed substantial increases.
- Among drivers positive for cannabis only and charged with impaired driving, the most common companion violations charged were lane-related violations, followed by speeding and failure to signal for turning movements.
- Cannabis and Driving Before and After New York’s Legalization of Cannabis
(Published February 2024) - Download Full Report
Drugs & Driving
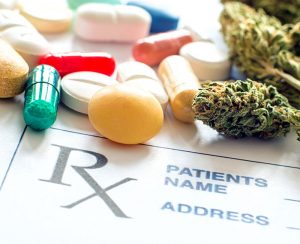 Based on an awareness that the use of both prescription drugs and illegal drugs continues to expand, ITSMR has conducted multiple studies to examine the issue of drugs and driving in New York. The most recent study focuses on drivers who were evaluated by a Drug Recognition Expert (DRE) for possible drug-impaired driving on New York’s roadways during the three-year period 2019-2021. This study provides key findings on the characteristics of the evaluation events, characteristics of the drivers evaluated, DRE opinions on the drug categories involved, and the results of toxicology testing.
Key Findings
- The number of DRE evaluations conducted decreased 7% from 2019 to 2020, followed by a 7% increase to 2,746 in 2021.
- 20% of the drivers evaluated in 2021 refused to take a chemical test, up from 13% in 2019.
- Of the drivers with chemical tests conducted, 23% had a urine test only, 74% had a blood test only in 2021.
- According to both the DRE opinions and the toxicology results, the most common drug categories in 2021 were cannabis and narcotic analgesics; and there were substantial increases in the prevalence of narcotic analgesics and CNS stimulants from 2019 to 2021.
- Drugged Driving in New York State: A View from the Drug Recognition Expert Program 2019-2021
(Published October 2022) - Download Full Report
Three earlier studies focus on: 1) the number and demographic characteristics of drivers ticketed for drug-impaired driving on NY’s roadways during the five-year period 2015-2019, 2) the extent to which fatal and personal injury crashes on NY roadways involve drugs, and the key characteristics of those crashes and the drug-involved drivers involved, over the five-year period 2015-2019, and 3) drivers ticketed for drug-impaired driving and drivers evaluated by a DRE during the three-year period 2016-2018.
- Drivers Ticketed for Drug-Impaired Driving on NY Roadways: 2019 Status Report
(Published February 2021) - Download Full Report
- Drug Involvement in Fatal & Personal Injury Crashes on NY Roadways: 2015-2019
(Published October 2020) - Download Full Report
- Drug-Impaired Driving on NY Roadways: Drivers Ticketed and DRE Evaluations 2016-2018
(Published November 2019) - Download Full Report
Recidivism
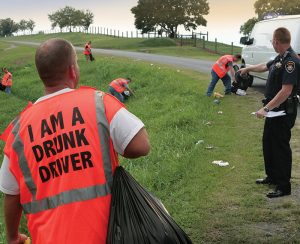 Over the past two decades, ITSMR has periodically examined the rate of recidivism among New York State drivers convicted of alcohol-impaired driving offenses. The recidivism rate was examined for the years 1999, 2009, 2012 and 2015. The analyses of driver license data for these years found that the rate of recidivism dropped substantially between 1999 and 2009 (22% vs. 29%), followed by much smaller decreases in 2012 and 2015. The objectives of this study were to determine whether the recidivism rate has continued to decline and to identify whether any changes have occurred in the profile of a recidivist driver over time.
This study was designed to provide information to the state’s traffic safety community and, in particular, the state’s Advisory Council on Impaired Driving to support the development of new or enhanced initiatives to reduce impaired driving. This Research Note presents information for the study years of 2012, 2015 and 2018.
Key Findings
- The recidivism rate was 20% in 2018, similar to the rate in 2015, but down substantially when compared to 1999 (29%).
- 77% of the recidivist drivers convicted in 2018 were sentenced to an ignition interlock, up from 73% 2012.
- RECIDIVISM IN NEW YORK STATE: 2018 STATUS REPORT
(Published August 2020) - Download Full Report
Evaluation of Leandra’s Law
 Enacted on November 18, 2009, Leandra’s Law provides for 1) increased criminal sanctions surrounding driving while intoxicated or under the influence of drugs with children under the age of 16 in the car, commonly known as Aggravated Driving While Intoxicated with Child in Vehicle (ADWI/Child in Vehicle) and 2) the expanded use of ignition interlock devices, making them applicable to any person who is convicted of a misdemeanor or felony DWI. ITSMR conducted separate studies of each component. Conducted in 2015, one study examined whether the component of the law that expanded the use of ignition interlock devices is effective in reducing the incidence of impaired driving. Conducted in 2020, the second study examined drivers arrested and convicted for driving impaired with a child under age 16 in the vehicle (VTL 1192.2ab) for the ten-year period since the inception of the law, 2010-2019.
Key Findings
- 27% of the 86,000 drivers convicted of alcohol-impaired driving between August 2010 and June 2015 and ordered to install an ignition interlock device actually had the device installed.
- 6,646 drivers were ticketed for aggravated DWI with a child under 16 in the vehicle (VTL 1192.2ab) over the ten years, 2010-2019, and 17% were involved in a crash in conjunction with their arrest. Of the 5,602 drivers whose case has been adjudicated, 97% were convicted.
- ADWI/CHILD IN VEHICLE
(Published September 2020) - Download Full Report
- IMPACT OF THE EXPANSION OF THE IGNITION INTERLOCK SANCTION
(Published September 2015) - Download Full Report
Drinking & Driving In New York State
 In 2009-2010, ITSMR conducted a major study on drinking and driving in New York State, The purpose of the study was to establish an estimate of how many motorists drink and drive and how often, and what would influence drinking drivers to change their behavior. The study involved a telephone survey of New York drivers and focus groups of drivers convicted of drinking and driving.
Key Findings
- Approximately 85,000 incidents of drinking and driving occur every day on New York roadways and approximately 1 out of 500 result in an arrest.
- There is an extremely high frequency of drinking and driving among convicted offenders; their perception of risk of arrest for DWI is low.
- 84% of drivers surveyed thought that drivers should be evaluated for a serious drinking problem after the first offense; 37% felt an interlock should be required after the second offense.
- DRINKING AND DRIVING BEHAVIOR OF MOTORISTS IN NY STATE
(Published November 2009) - Download Full Report
- A STUDY ON DRINKING AND DRIVING IN NY STATE: A FOCUS GROUP APPROACH
(Published December 2009) - Download Full Report
- A STUDY ON DRINKING AND DRIVING IN NY STATE: SURVEY OF DRIVERS
(Published March 2010) - Download Full Report
Fact Sheets
Recidivism 1999, 2009, 2012, 2015 & 2018
August 2020
Impaired Driving Arrests and Crashes involving a Substance-Related Driver: 2019-2023
December 2024
Impaired Driving Arrests and Crashes involving a Substance-Related Driver: 2018-2022
March 2024
Impaired Driving Arrests and Crashes 2017-2021
December 2022
Impaired Driving Arrests and Crashes 2016-2020
October 2021
Impaired Driving Arrests and Crashes 2014-2018
October 2019
Impaired Driving Arrests and Crashes 2013-2017
October 2018
Impaired Driving Arrests and Crashes 2012-2016
October 2017
Impaired Driving Arrests and Crashes 2011-2015
October 2016
Crashes involving a Drug-Related Driver: 2019-2023
December 2024
Crashes involving a Drug-Related Driver: 2018-2022
March 2024
Crashes involving a Drinking Driver: 2019-2023
December 2024
Crashes involving a Drinking Driver: 2018-2022
March 2024
Crashes – Drug-Related 2017-2021
December 2022
Crashes – Drug-Related 2016-2020
November 2021
Crashes – Drug-Related 2015-2019
November 2020
Crashes – Drug-Related 2014-2018
October 2019
Crashes – Drug-Related 2013-2017
October 2018
Crashes – Drug-Related 2012-2016
October 2017
Crashes – Drug-Related 2011-2015
October 2016
Crashes – Drug-Related 2010-2014
October 2015
Alcohol-Related Crashes 2017-2021
December 2022
Alcohol-Related Crashes 2016-2020
November 2021
Alcohol-Related Crashes 2015-2019
November 2020
Alcohol-Related Crashes 2014-2018
October 2019
Alcohol-Related Crashes 2013-2017
October 2018
Alcohol-Related Crashes 2012-2016
October 2017
Alcohol-Related Crashes 2011-2015
October 2016
Alcohol-Related Crashes 2010-2014
October 2015
Alcohol-Related Crashes 2009-2013
December 2014
Alcohol & Drugged Driving Arrests: 2019-2023
December 2024
Alcohol & Drugged Driving Arrests: 2018-2022
December 2023
Alcohol & Drugged Driving Arrests: 2017-2021
December 2022
Alcohol & Drugged Driving Arrests: 2016-2020
November 2021
Alcohol & Drugged Driving Arrests: 2015-2019
November 2020
Alcohol & Drugged Driving Arrests: 2014-2018
October 2019
Alcohol & Drugged Driving Arrests: 2013-2017
October 2018
Alcohol & Drugged Driving Arrests: 2012-2016
October 2017
Alcohol & Drugged Driving Arrests: 2011-2015
October 2016
Alcohol & Drugged Driving Arrests: 2010-2014
November 2015
Aggravated DWI 2021-2023
December 2024
Aggravated DWI 2020–2022
December 2023
Aggravated DWI 2019-2021
December 2022
Aggravated DWI 2018-2020
December 2021
Aggravated DWI 2017-2019
December 2021
Aggravated DWI 2016-2018
July 2019
ADWI with Child Under 16: 2019-2023
December 2024
ADWI with Child Under 16: 2018-2022
December 2023
ADWI with Child Under 16: 2017-2021
December 2022
ADWI with Child Under 16: 2016-2020
December 2021
ADWI with Child Under 16: 2015-2018
July 2019
Discover more data in the Traffic Safety Statistical Repository (TSSR)
Developed to provide broader access to New York’s traffic safety data, the TSSR contains motor vehicle crash data obtained from the NYS Department of Motor Vehicles (DMV) Accident Information System (AIS) over the past 10 years, including preliminary data for the current year.
